Wikipedia has a challenger in the category of user created encyclopedia content. Everipedia (the encyclopedia of everything) is based on a blockchain model. The new platform is being promoted by notables including the cofounder of wikipedia. I am not certain I understand the logic of why a blockchain approaches offers an advantage or why a competitor is necessary. I guess this venture promises benefits to contributors beyond the satisfaction of sharing their knowledge. This is not an endorsement, but I do think it is worth a look.
Librarian and blogger Doug Johnson has a new post on the future of ebooks and concludes that digital books are the future. I have tried to make this same point multiple times mostly challenging the argument that comprehension is better when reading from a traditional paper book. While possibly true, my argument traditional differentiates reading and studying and for educational and professional purposes, I would describe book-related behavior as more studying that reading. Johnson’s post includes a list of advantages that is helpful and posts to other posts he has written on ebooks.
Posted inUncategorized|Taggedbook|Comments Off on ebooks are the future
A post with the title “The web is dead” got me thinking about this topic and the arguments made by the author. Of course the author is using the term “web” in a specific way. His reference is to web content hosted directly or indirectly (on a server providing web sites) by individuals or groups, linked to offer the benefits of a web, and not Internet content in general. He differentiates social media from “the web” pretty much based on the factors of hosting and control.
The author argues that the web is dying because content ages and links become broken. I agree, but I still see this as an inconvenience rather than a fatal flaw. I would suggest that taking on the technological challenge of being in charge of your own site is most likely the biggest challenge to wider use. The challenge varies depending on whether you want to rent server space or use a service such as Blogger or WordPress.com, but in either case running a web site requires some learning.
The author makes one point about links among sites I totally agree with. Links as used by the early Google was a reasonable way to identify quality content on the web. Brin and Page used a system they called “page rank” based on the system academics use to estimate the value of scholarly publications. The more times other academics reference a paper, the more useful, important, or influential it must be. It is not a perfect system, but as a numerical estimate of quality it works pretty well. Google moved on from page rank for reasons of self interest. Google realized that their system would be more lucrative (i.e, sell more ads) if users found links they agreed with at the top of search results. For many types of search (e.g., politics), there is a difference between information that is most accurate and information that appeals to personal interests. To get from pagerank to this system, Google began collecting data on user behavior and working these data into the search algorithm. I really wish a search service would either return to a page rank type approach or offer page rank as a search option.
The issue of search aside, I write a blog instead of posting this type of content to Facebook, Medium, or some other social/composite service because I value maintaining control of my own content and in reaction to the ways by which services like Facebook make income. Hosting my own blog costs me and probably limits my readership, but principles are important and my focus is more on maintaining blogs as a long term goal.
To make use of blogs as an information source, I suggest users must:
K12 schools have already started or will start very soon so suggesting key online services educators should be familiar with is probably a little late. I agree, but I just encountered this list (50 Web 2.0 sites for schools) and decided tardiness is all relative. By the way, the 50 site list is worth exploring. However, such lists are more suited to the adventurous and those who see their work as making recommendations. For most educators, it is past time to explore and time to focus. Hence, my pick 3 – suggestions for middle and high school educators.
First, I am kind of cheating here because my picks are really services that offer a suite of tools. In my defense, the focus is to consider tools that do not burden users with different connection methods, payment plans, interfaces, but offer versatility and instructional/learning relevance.
Zoom – OK, so you may have your own favorite video environment (e.g., Google Meet, Microsoft Teams) and for all practical purposes what you use is a “pick em”. I recommend Zoom because it is the service I have actually used in a classroom setting and because it offers versatility – e.g., recording, chat, breakout rooms, access control, show screen).
Google Drive – I would describe this as a multi-tool, content creation environment offering opportunities for collaboration, commenting, and revision. It can be used to present content to learns and for learners to create content as a way to process information and develop communication skills. The tools include opportunities for feedback and feedback related revision.
InsertLearning – This likely the recommendation most likely to be unfamiliar to educators. It is based in personal assumptions about the use of existing online content as valuable and what I think are needed tools necessary to guide inexperienced learners in processing this content. InsertLearning is one of multiple services that offer what I have taken to describing as “layering” capabilities. What I mean by this is that the educator (and in some ways the learner) can start with an information resource and add elements (highlights, annotations, questions, discussion opportunities) that result in content I think is a more effective educational resource. This tool goes beyond the addition of such elements to include mechanisms for collecting and organizing student engagement with content that can be helpful to educators in making assignments and providing feedback and grading. InsertLearning is specific to web pages. I wish there was a tool that could do layering for both web pages and web videos, but to my knowledge there is not a service of equivalent power for this combination. Other tools do exist for extending online video. See my existing content on multiple layering tools for a deeper description of InsertLearning and tutorials on other services.
As I have explored the topic for which I have yet to find a suitable descriptive phrase, I have encountered similar existing initiatives. Claiming originality should always be done with great care. One source I intend to use for several posts seems to have been the focus of school libraries who describe this topic as data literacy and see an important role for librarians relevant to this topic in guiding and supporting student activities in developing this literacy. Without a formal claim of responsibility, I am left to speculate regarding how the connection with the role of librarians explains their interest. My guess is that librarians see data literacy as involving answering certain questions based on a type of information resource (data sources) and librarians exist to help connect users with information resources. I will explore this position and provide some references as my series of learning to generate and use data continues.
One category of public data your librarian might acquaint you with would consist of datasets and databases such as what might be available from the CDC (https://www.cdc.gov/datastatistics/ – selected as an example because of our present situation) or data.gov (https://www.data.gov/). Various activities might be based on the analyses of the data provided. Before I retired, I was aware of academic colleagues who were applying advanced statistical procedures to public data to look for relationships among variables in data that had not been considered.
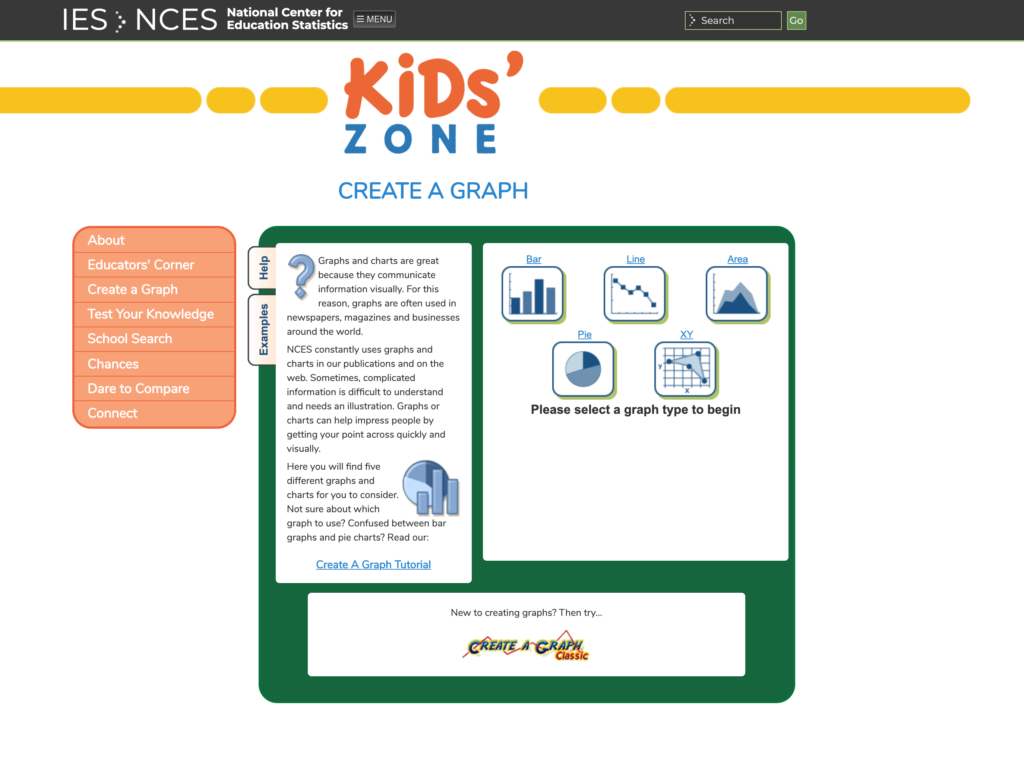
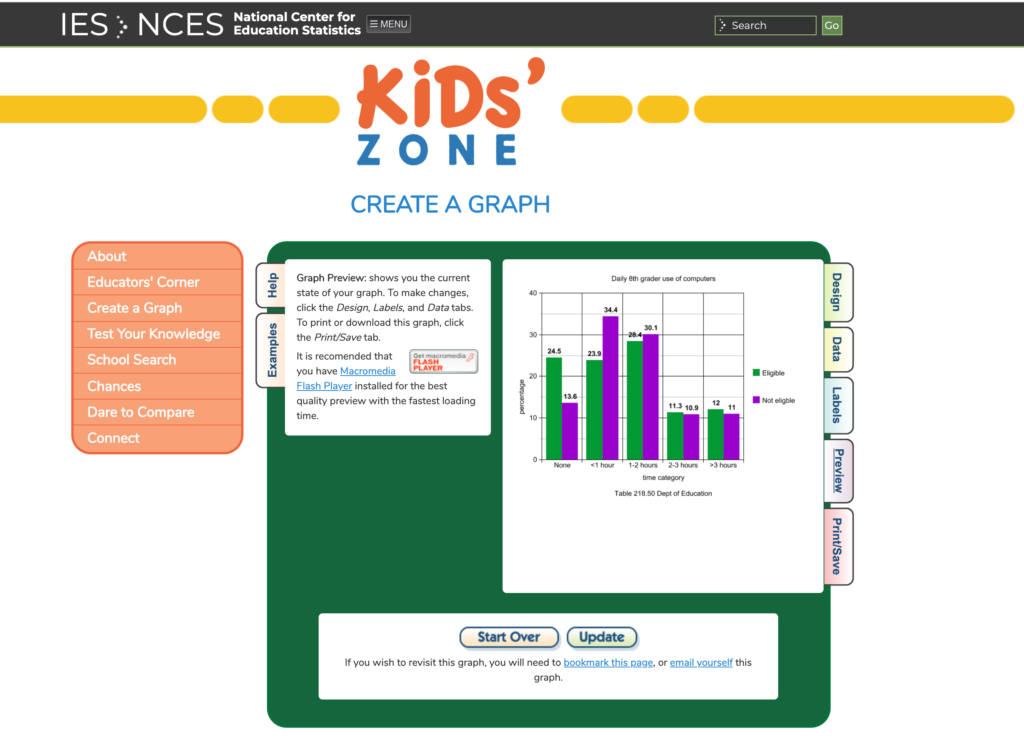
My example here is far less sophisticated. It is also not original as it is proposed by one agency providing such data. The data provided by the U.S. Department of Education (https://www2.ed.gov/rschstat/landing.jhtml) even proposes the use of a graphing tool students can apply to data – Kids’ Zone – Create a Graph (https://nces.ed.gov/nceskids/createagraph/).
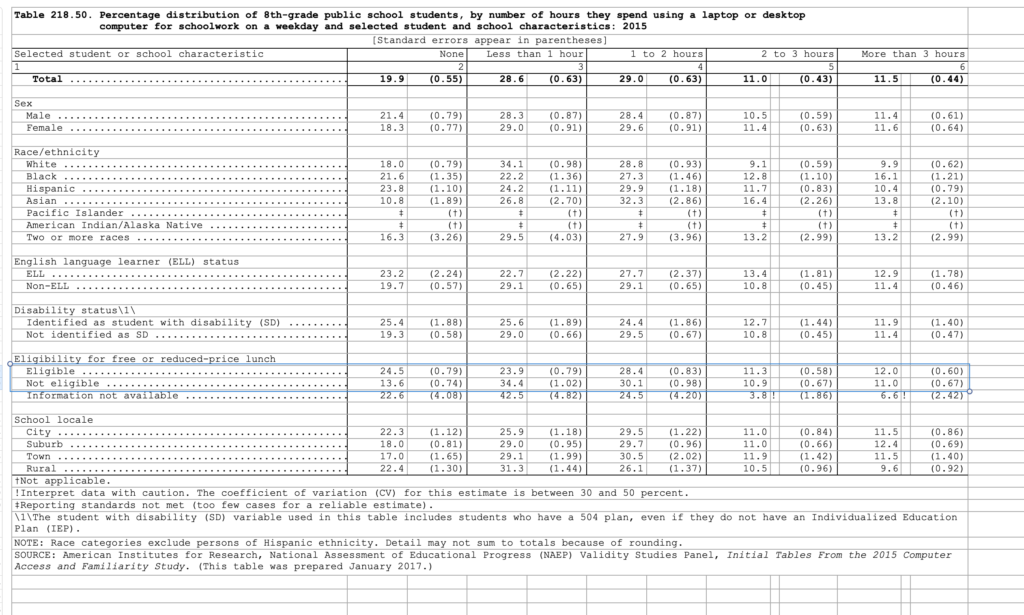
I thought I would use graphing to explore data that interests me. The data that caught my attention was taken from a table summarizing 8th graders daily use of a computer broken down by various categories (Table 218.50). I think you can expand this image to read the two rows of data I am focusing on here. These data concern whether a given student qualifies for free/reduced lunch (a proxy for SES) and amount of use.
The data table can be downloaded as a xls file (the type of file for use in an Excel Spreadsheet or other spreadsheet program) or just read from the chart.
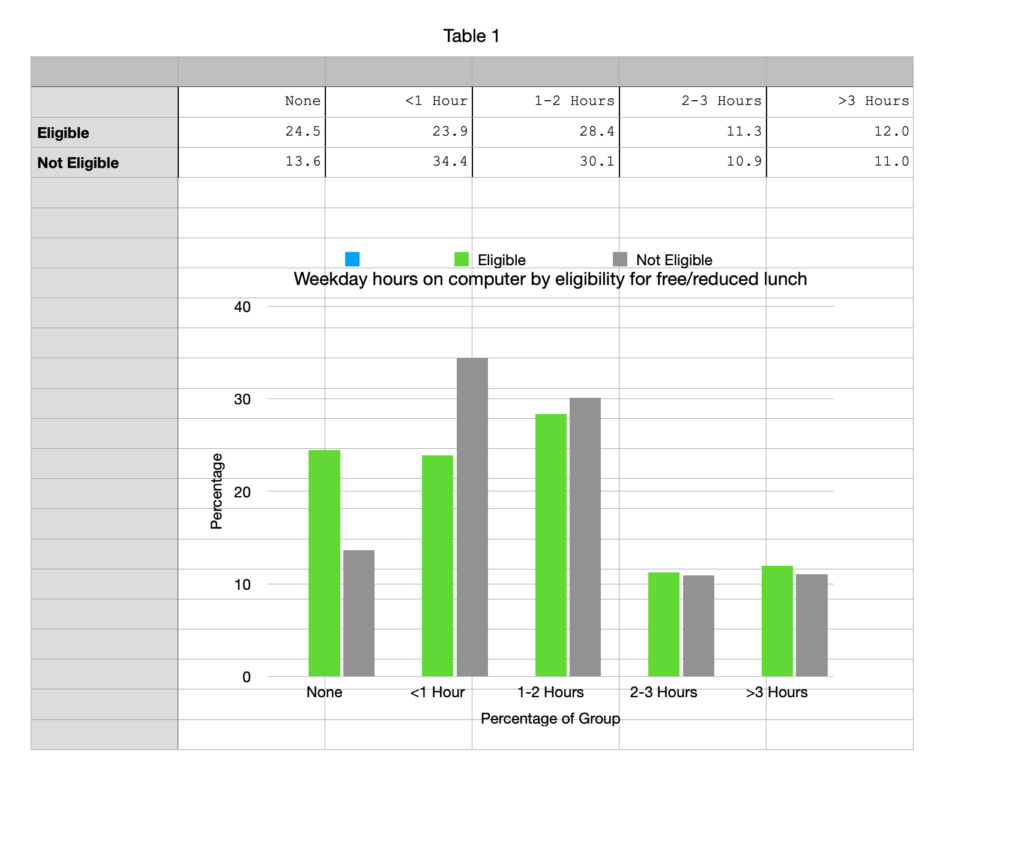
With a spreadsheet, I can select the cells that interest me and turn the values into a graphic representation.
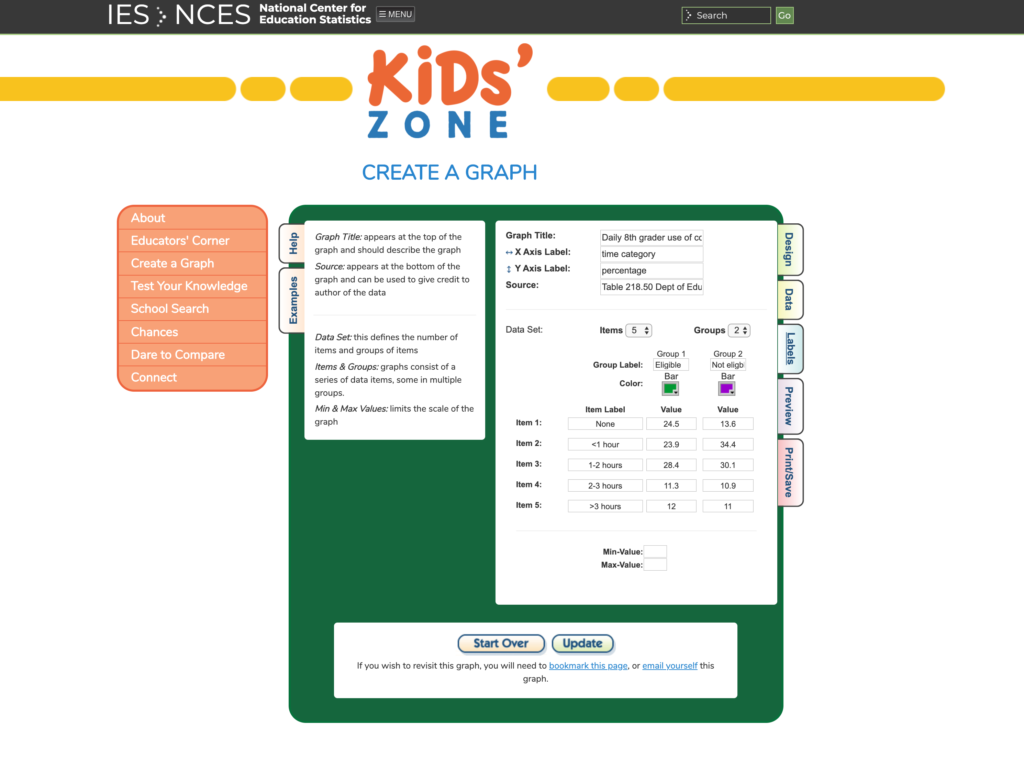
With the Create a Graph program, the data would be entered directly from the keyboard to generate a similar representation.
Now we have bar graphs representing data summarizing 8th graders daily use of a computer. What can be observed? Perhaps you find the percentage of 8th graders who report no use interesting. What does this mean? What would you need to know about the methodology that would help you understand? For example, would an iPad be counted as a computer? What about the difference in family resources? The largest gaps are in the groups claiming no use and the group claiming a small amount of use? Here low income seems to matter. It does not seem to matter among the groups using a computer quite a bit. Do you wonder if this was because computers were provided by the schools and this is where most computer use occurred? Research always leads to more questions when the data are limited and the methodology does not allow an answer to questions asked after the process of data collection is complete.
I intend to write a couple more posts focused on the recommendations from the library association. I would describe my goals as very much overlapping with the way this association describes data literacy. If there is a distinction, I would describe it as my interest in data and data collection methods that are not numerical. If data literacy is limited to quantitative data, I must still find another terminology to describe this broader perspective.
Posted inUncategorized|Comments Off on Using data to promote data literacy
First, data is plural [when it refers to information and not used as an example of a word]. It is the version of datum used to indicate more than one datum. It is difficult to keep that straight as it is so often used incorrectly that many have given up asking for a correction. Data as a singular noun even sounds right. I try to be careful, but no one corrects me any more. Try submitting a research manuscript though claiming “the data is ….” and you will be notified.
So, this my first effort to bring the attention of educators and those who try to focus what educators do on the importance of student experience developing expertise in data collection (methodology) and interpretation. My interest is in the absence of such experiences and the personal belief that the development of data-related collection and analysis skills is more important than other semi-important initiatives such as the focus on coding and computational thinking. I have yet to come up with catchy one or two-word description of the capabilities and dispositions I am focusing on. Data literacy is close and would work, but is already taken and it tends to be defined in a way that is too narrow. The existing use of data literacy is too focused on numerical data and other important categories of data (by my way of thinking) exist,
The collection of data can lead to thinking which I think is key to learning. Thinking does not necessarily have to follow data access, but thinking as an educational task is a matter of taking the opportunities that are there.
I have a record of a very high proportion of the songs I have listened to since 2006. The total number of songs at the start of the time I was writing this was 280,063, but it will be different by the time I am finished because I almost always have music playing in the background when I work. [Remember this comment because it is a clue to something I will ask of you later.] The number 280,063 is potentially interesting because it may indicate something about me relative to you. I may be a bigger music fan than you and maybe not. The number alone hides other interesting data. 280,063 is a statistic that summarizes something about the data. The data in the rawest form consist of a list of song/artist titles. A very long list. Each item on this list is connected with a time and date (when does he and did he listen) and has been categorized by the company responsible for the service by genre (has this old guy’s tastes changed over the years). BTW – the service I use is called Last.FM and the process of sending a signal from the multiple digital devices I use to listen to music to the giant database maintained by the service is called scrobbling. I can’t scrobble when I listen to the radio in my truck or when some member of my family uses the Amazon Echo. But when I am listening to music I select, I am nearly always using a phone, tablet, ipod, ipad, or computer. For those who have now returned to listening to music recorded on records, I get you, but aside from the hiss I think your claim to authenticity is bogus. Authenticity changes with the times. You aren’t listening to piano rolls are you? I admit the general digital-oriented basis for my existence is also somewhat uncommon, but I am what I am.
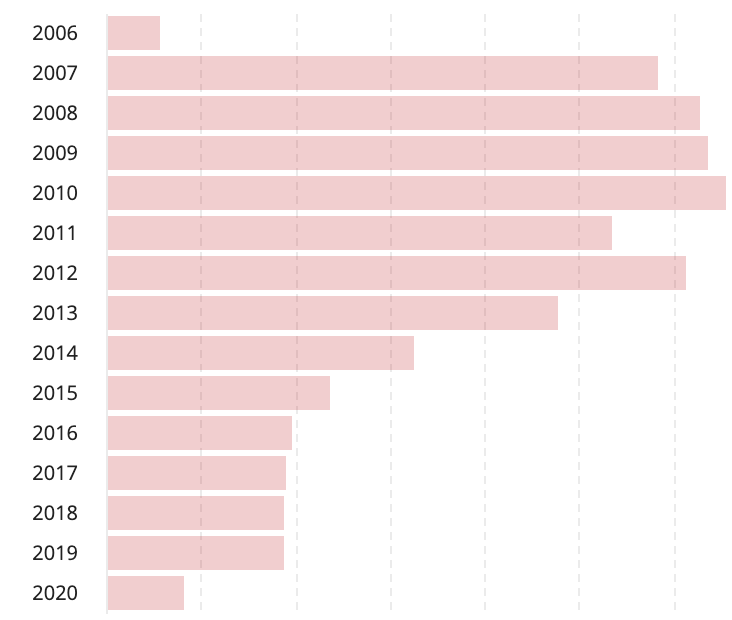
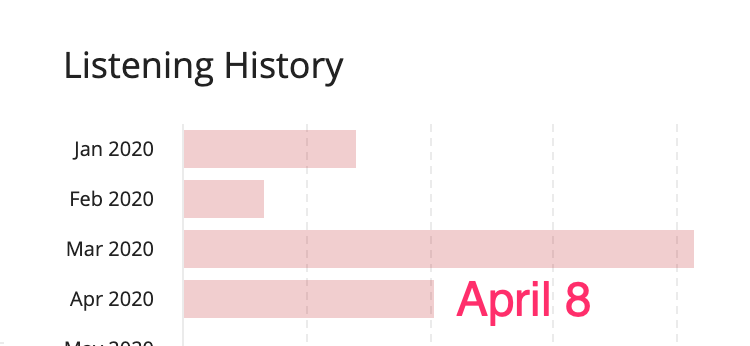
Just for kicks, I want to show you two charts that summarize these data and because of the trends that are evident ask for an explanation. I will refer to these summary representations as graph A and graph B. I think they show the same thing even though they seem to be moving in opposite directions. The first is the number of songs heard by year and the second the number of songs heard in recent months.
These bar graphs use one form of data to demonstrate something interesting about my life [see the clue I warned you about in one of the first paragraphs]. I obviously know things about my life you don’t and what I know brings meaning to these representations.
Some things I know: I work a lot and when I work I most frequently am reading, writing, coding, etc. using a computer. I retired a few years ago [graph A]. All of our lives have changed recently and we are spending most of our time now isolated in our homes [graph B] finding things to do that are somewhat defined by this reality.
Some reference points. In 2010, I listened to 32,728 songs. In Mar 2020, I listened to 2072 songs and 1226 songs through the first 8 days of April. The average length of a song is between 3-5 minutes, but varies significantly with genre. I suppose this fact is somehow useful in interpretation, but even 3 vs 5 is a large difference when you multiple the limits by 320,000 or so.
I wonder if these data say anything about my psychological state. I listen to a lot of blues, but blues for me is a happy genre. I listen to classical when I am in a somber mood.
Lifetime top artist – Miles Davis – 3919 listens
List 365 days – Bob Marley – 116 plays
Posted inUncategorized|Comments Off on Data are everywhere
We use cookies to ensure that we give you the best experience on our website. If you continue to use this site we will assume that you are happy with it.
You can revoke your consent any time using the Revoke consent button.


You must be logged in to post a comment.