
Descriptive statistics are very useful in the kind of writing that I do. Whether it is a textbook for future K12 educators or a blog post for practicing educators, being able to factually support a description of trends or offer some insight into the circumstances of a typical classroom, data in the form of charts or just simple descriptive statistics is helpful.
What I offer in this post is a link to a source for current statistics on computer science instruction. I highlight a few statistics here that offer insights into topics I find particularly interesting, but also promote this source as it offers a way to examine related issues on different levels (e.g., state and in some cases districts). I keep such links carefully curated for future wiring projects.
It is always important to consider the methodology used to accumulate statistics. The stereotype that anyone can lie with statistics has always annoyed me. The statistics don’t lie, but can be misleading if based on a flawed methodology. Pulling together data on a grand scale relies on contributions from other sources and may make assumptions about the comparability of the systems used to collect information and the willingness of the parties studied to share.
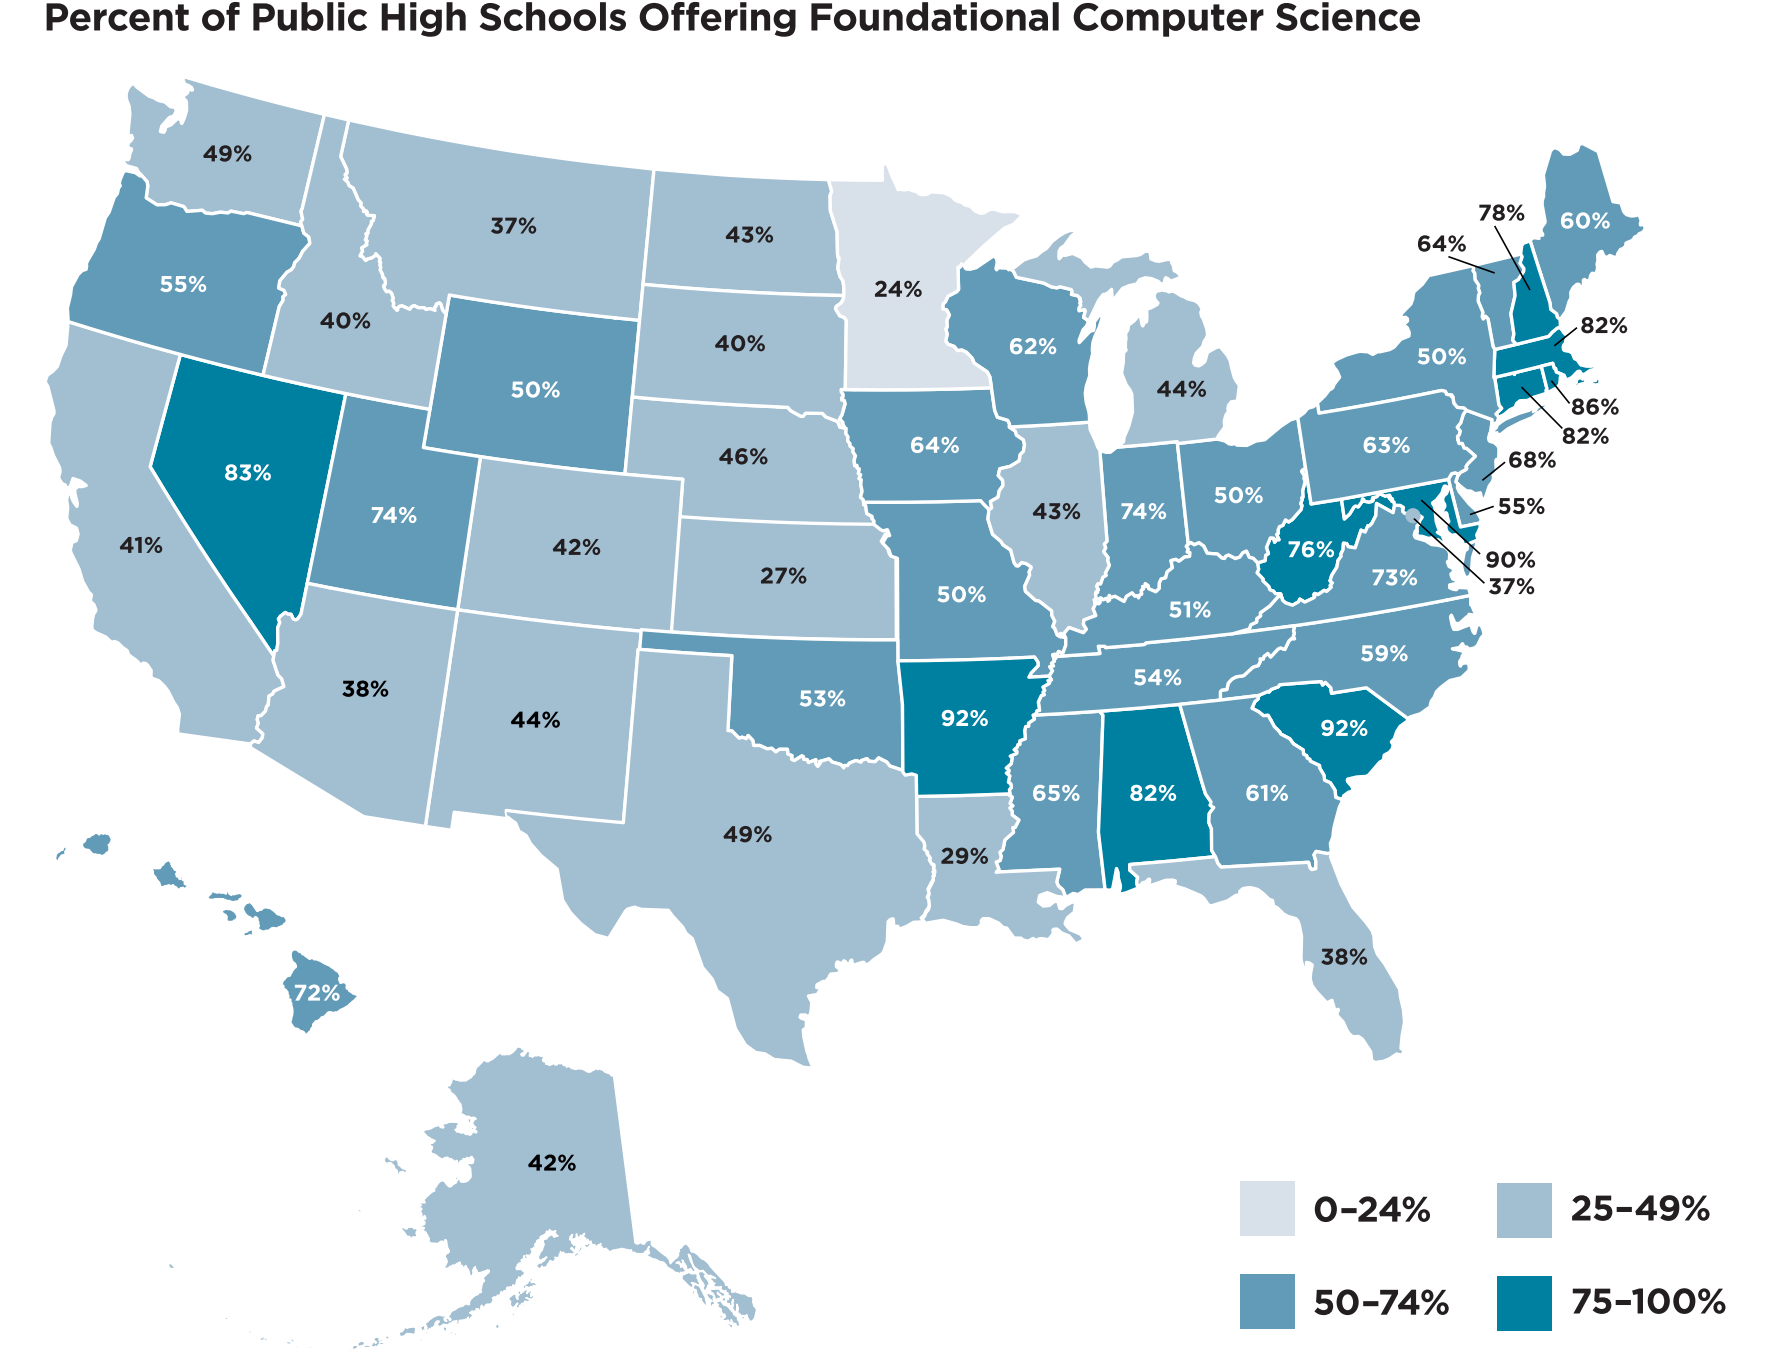
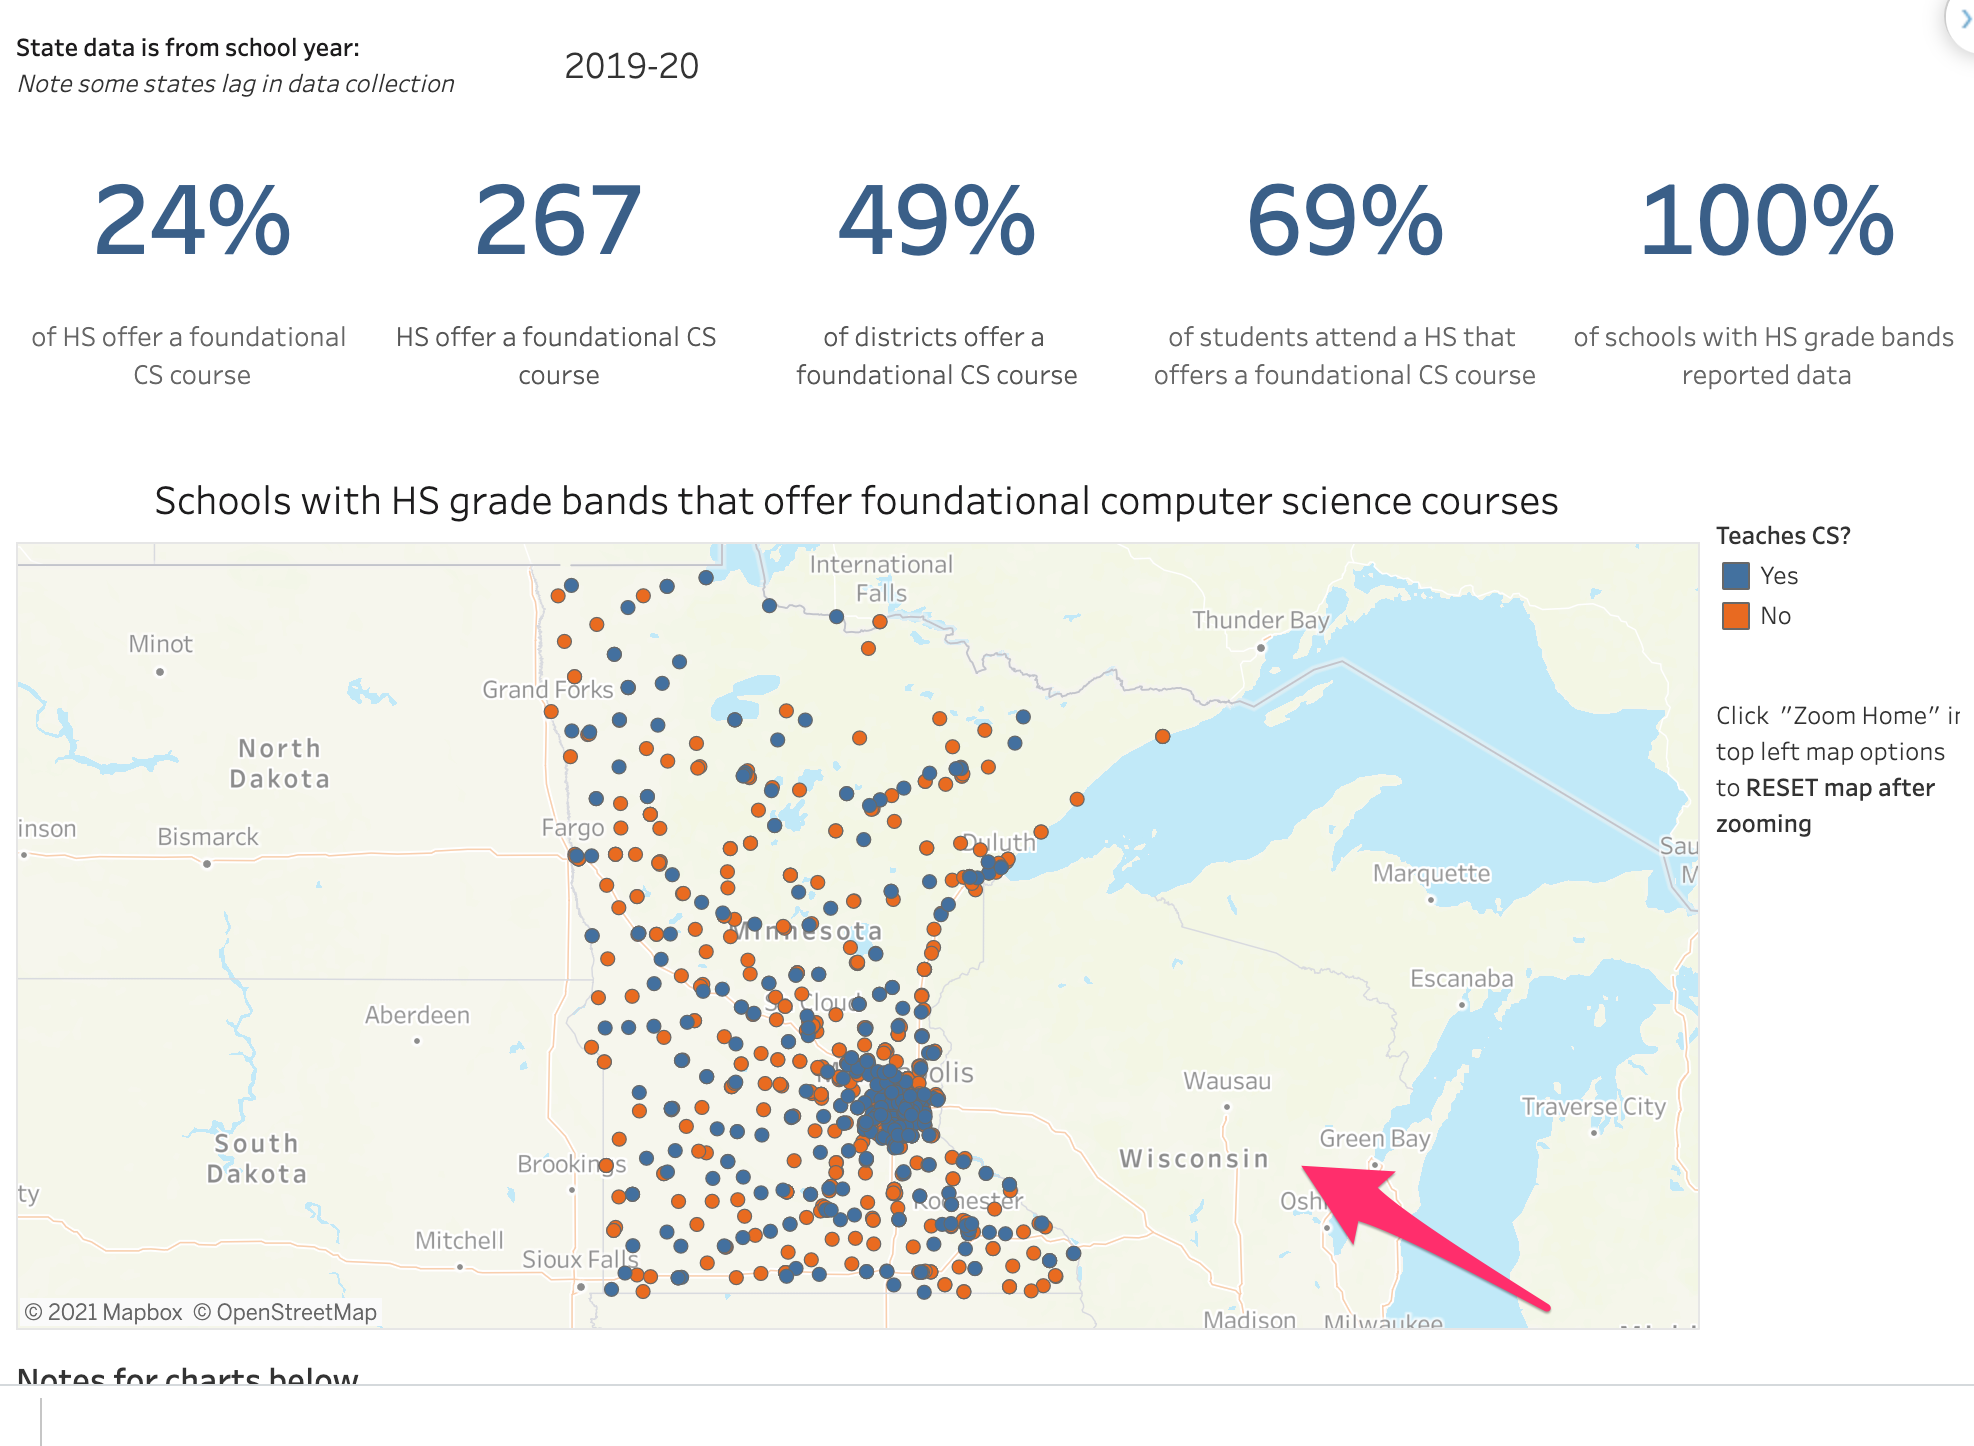
The site also contains an interactive way to locate statistics from individual states.
![]()
You must be logged in to post a comment.